
Trading systems
Backtests that lie: two bugs that made a losing strategy look robust
An audit of our trading research platform found two quiet bugs. One labelled a consistently losing strategy as robust; the other filled stop-losses at prices that never traded. Here is how each one happened and the one-line rules that fixed them.
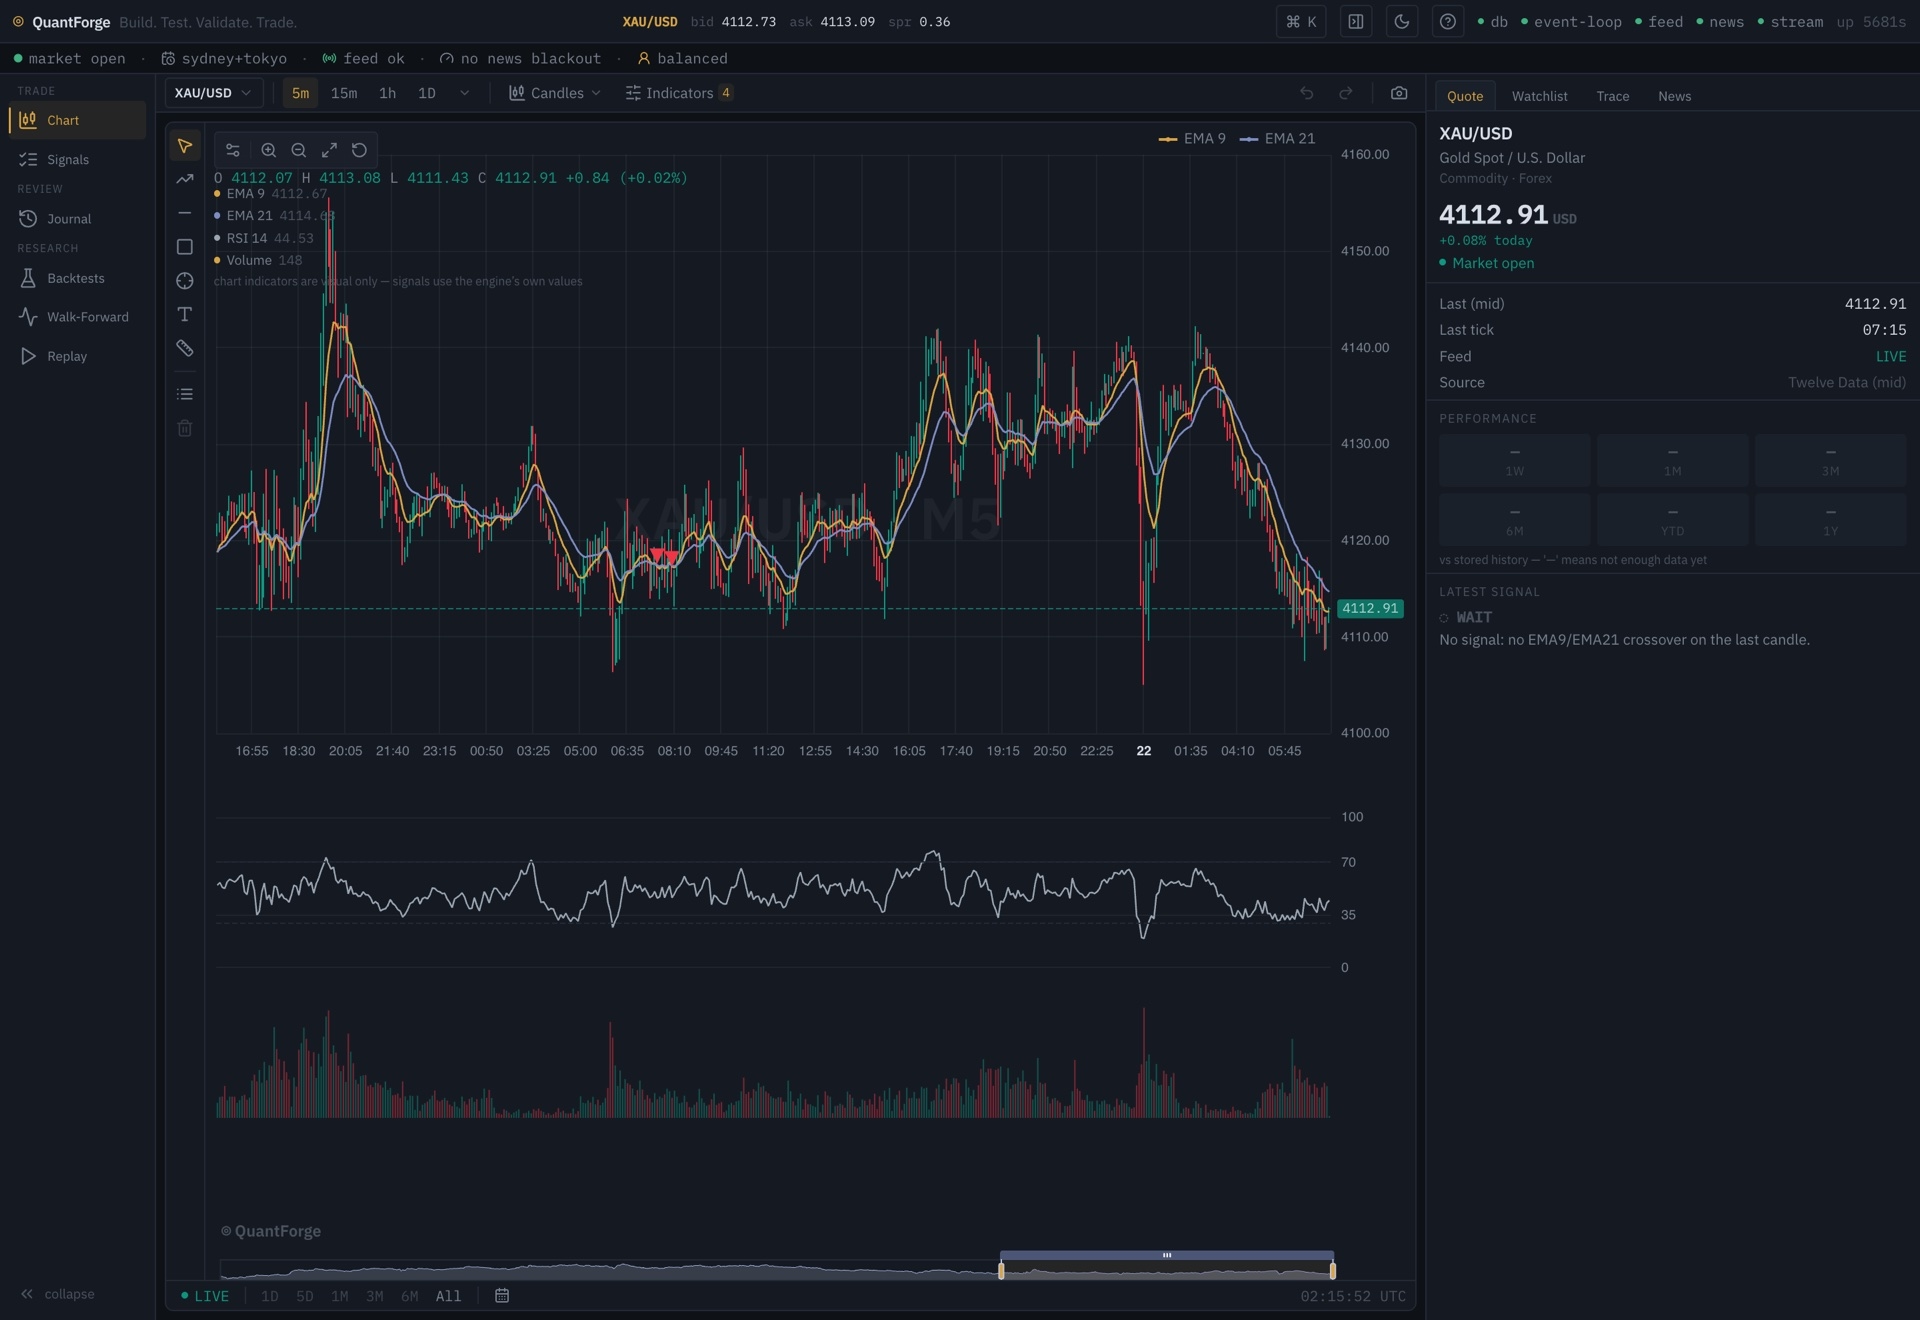
QuantForge is our private research workstation for gold (XAU/USD). It has a signal engine, a risk engine, a trade journal, reproducible backtests, walk-forward validation and candle-by-candle replay. Its whole purpose is to answer one question honestly: does this idea make money on data it has not seen?
A backtesting tool that answers that question too optimistically is worse than having no tool at all, because it gives you confidence you have not earned. In October we ran a structured audit of the research code. Two of its findings are worth sharing, because both bugs are easy to write, look correct in review, and push results in the flattering direction.
Background: walk-forward validation
A single backtest over a whole dataset tells you very little. With enough parameters, any strategy can be tuned to fit the past. Walk-forward validation is the standard defence:
- Split history into consecutive windows.
- In each window, optimise on an in-sample (IS) period.
- Test the chosen parameters on the out-of-sample (OOS) period that immediately follows, which the optimiser never saw.
- Roll forward and repeat.
At the end you compare how the strategy did in-sample against how it did out-of-sample. If performance collapses OOS, the in-sample results were mostly curve fitting.
Our runner summarises this as a verdict: robust, degraded or insufficient.
Bug 1: a stable loser counted as robust
The original verdict rule looked at two things: whether there were enough out-of-sample trades, and the average degradation ratio, meaning out-of-sample profit factor divided by in-sample profit factor.
verdict:
  oosTrades < 10 || avgDegradation === null
    ? 'insufficient'
    : avgDegradation >= 0.7
      ? 'robust'
      : 'degraded',
The idea is reasonable. If OOS performance keeps at least 70% of IS performance, the edge seems to carry over.
The flaw is that a ratio measures consistency, not profitability. Take a strategy that loses money in-sample and loses about the same amount out-of-sample. Its profit factor is below 1 in both periods, so the ratio between them is close to 1. By this rule, a strategy that reliably loses money is "robust".
That is not a hypothetical edge case. When most of the parameter grid is unprofitable, which is normal for a new idea, the cells that lose evenly will pass the ratio test.
The fix is one extra condition. A robust verdict needs both a stable ratio and a positive out-of-sample net result:
/**
 * `robust` needs BOTH a stable IS→OOS profit-factor ratio (≥ 0.7) AND a positive
 * out-of-sample net: a strategy that loses consistently has a ratio near 1 and
 * must never be called robust.
 */
export function verdictFor(a: {
  oosTrades: number
  avgDegradation: number | null
  oosNetR: number
}): 'robust' | 'degraded' | 'insufficient' {
  if (a.oosTrades < 10 || a.avgDegradation === null) return 'insufficient'
  return a.avgDegradation >= 0.7 && a.oosNetR > 0 ? 'robust' : 'degraded'
}
oosNetR is the total out-of-sample result in units of risk (R), summed across all walk-forward windows. The verdict moved into its own exported function, so it can be tested directly. One of the new tests is exactly the case above: a consistent loser with a ratio near 1 must come back degraded.
The lesson: a ratio of two numbers hides their sign. Whenever a metric is "A relative to B", ask what it says when both A and B are bad.
Bug 2: stops filled at prices that never existed
When the journal resolves a trade from candle data (rather than from ticks), it has to decide at what price a stop-loss was filled. The original rule was the natural one: if the candle's range touched the stop, the trade exited at the stop price.
That is correct most of the time. It is wrong whenever the market gaps. Gold trades almost around the clock, but it still has gaps: at the weekly open, after a session break, or on a sharp move around news. If a long position has its stop at 2,400 and the next candle opens at 2,390, no trade at 2,400 was ever possible. A real stop order becomes a market order and fills somewhere around 2,390, or worse.
Filling at 2,400 credits the backtest with ten dollars per ounce that it could not have had. On one trade it is small. Across a year of trades, gap fills systematically shave the worst losses, and they do it precisely on the trades where risk management matters most.
The rule now is: a stop fills at its level, unless the candle opened beyond it, in which case it fills at the open.
/** A stop fills at its level, or at the candle open when the candle gapped through it. */
function stopFill(
  signal: Pick<SignalRecord, 'direction' | 'sl' | 'trailSl'>,
  open: number | undefined,
): number {
  const stop = stopOf(signal)
  if (open === undefined || !Number.isFinite(open)) return stop
  return signal.direction === 'buy' ? Math.min(stop, open) : Math.max(stop, open)
}
For a buy, the fill is the lower of the stop and the open. For a sell, it is the higher. The same rule applies to trailing stops.
Equally important is what we did not do for take-profits. If the market gaps through a take-profit in your favour, a real limit order might fill at a better price. The resolver still fills at the take-profit level and does not credit the favourable gap. The asymmetry is deliberate. When a backtest cannot know the true fill, it should assume the worse one.
The full set of fill rules is now written at the top of the resolver:
- a stop (initial or trailed) fills at the stop, or at the open if the candle gapped through it;
- a take-profit fills at its level, never better;
- an expiry fills at the candle close;
- the spread is already in the entry price; slippage and commission are modelled by the tick engine, not by the candle resolver.
Bug 3, briefly: reporting how much data you actually used
The audit had a smaller finding about reporting. Our parameter-grid report printed "ticks" as the largest tick count any run had processed. But a run that blows its risk limit stops early, so its count says how far it got, not how much data existed. When all 108 cells of one grid were ruined in training, the report understated the dataset size.
Now dataset and training-window sizes come from the data store itself, and each ruined cell reports when it was ruined and how far through the data it had got.
What we took away
- Make the verdict a function, and test the uncomfortable cases first. A losing strategy, an empty window, a cell that is ruined on day one.
- Never let a ratio stand alone. Pair it with an absolute, signed result.
- Fill at prices that existed. When the data cannot tell you the fill, assume the worse one.
- Write the rules in the code. A comment listing every fill rule is the first thing a reviewer reads, and the first thing the next audit checks.
Neither bug was clever. Both survived because the output looked plausible. That is what makes research code dangerous: wrong numbers that look plausible are the ones nobody questions.
- Trading
- Backtesting
- Walk-forward
- Quant
- TypeScript
- Risk